Diagnostics
The BSB is instrumented with OpenTelemetry for observability and diagnostics purposes. This guide explains how to set up tracing and profiling for development and debugging.
Installation
BSB packages depend on bsb-otel for lightweight API-only tracing. To
actually run BSB with observability (exporters, the opentelemetry-instrument
CLI, and test fixtures like OTelFixture), you need the SDK extra:
pip install 'bsb-otel[sdk]'
Without this extra, importing OTelFixture or JSONLinesSpanExporter, or
running opentelemetry-instrument, will raise an ImportError with install
instructions.
Overview
The basic functionality of OpenTelemetry is to collect traces, events, and metrics.
Traces: Represent the execution path of a request through the system, capturing function calls, spans, and durations.
Events: Time-stamped annotations or logs attached to spans, providing contextual information about specific points in execution.
Metrics: Aggregated measurements such as counters, gauges, and histograms to monitor system performance over time.
We want to make sure that we export these entities to a collector, so that we can view the recorded data later on the collector. This means we need to configure OpenTelemetry on 2 sides:
Exporter: Configured in the Python process, it sends collected traces, events, and metrics to the collector. This typically involves setting the exporter type (OTLP, Jaeger, Prometheus, etc.), endpoint, and security options.
Collector: A separate service, such as Jaeger running in Docker, which receives, aggregates, and stores the telemetry data. The collector can then forward the data to UI dashboards for inspection and analysis.
This dual configuration ensures that instrumentation in code generates telemetry while the collector provides a centralized view for diagnostics and performance monitoring.
Jaeger Setup
To collect and visualize traces, you can use Jaeger. The easiest way to set up Jaeger is using Docker:
docker run -d \
    --name jaeger \
    -p 9411:9411 \
    -p 4318:4318 \
    -p 4317:4317 \
    -p 16686:16686 \
    -p 5778:5778 \
    cr.jaegertracing.io/jaegertracing/jaeger:2.9.0
Visit http://localhost:16686 and have a look around. Since no one is sending any OpenTelemetry data to Jaeger yet, there won’t be much to see yet.
OpenTelemetry Instrumentation
The BSB supports OpenTelemetry instrumentation through the opentelemetry-instrument command-line tool, which provides zero-code instrumentation capabilities. For detailed configuration options, refer to the OpenTelemetry Python Documentation.
The following command demonstrates how to enable tracing and metrics, and to send the data to your Jaeger docker:
opentelemetry-instrument \
    --traces_exporter otlp \
    --exporter_otlp_endpoint http://localhost:4317 \
    --service_name "BSB Workflow" \
    python -m bsb compile --clear
Command options explained:
- --traces_exporter otlp: Send data via OTLP protocol
- --exporter_otlp_endpoint http://localhost:4317: Specifies the OTLP endpoint, to send the data to your Jaeger docker.
- Additional options can be found in the OpenTelemetry Python documentation
The instrumentation will: - Export traces to both console and OTLP endpoint for analysis - Send OTLP data to the configured Jaeger instance (or other compatible backends) - Automatically instrument the BSB compilation process with minimal overhead
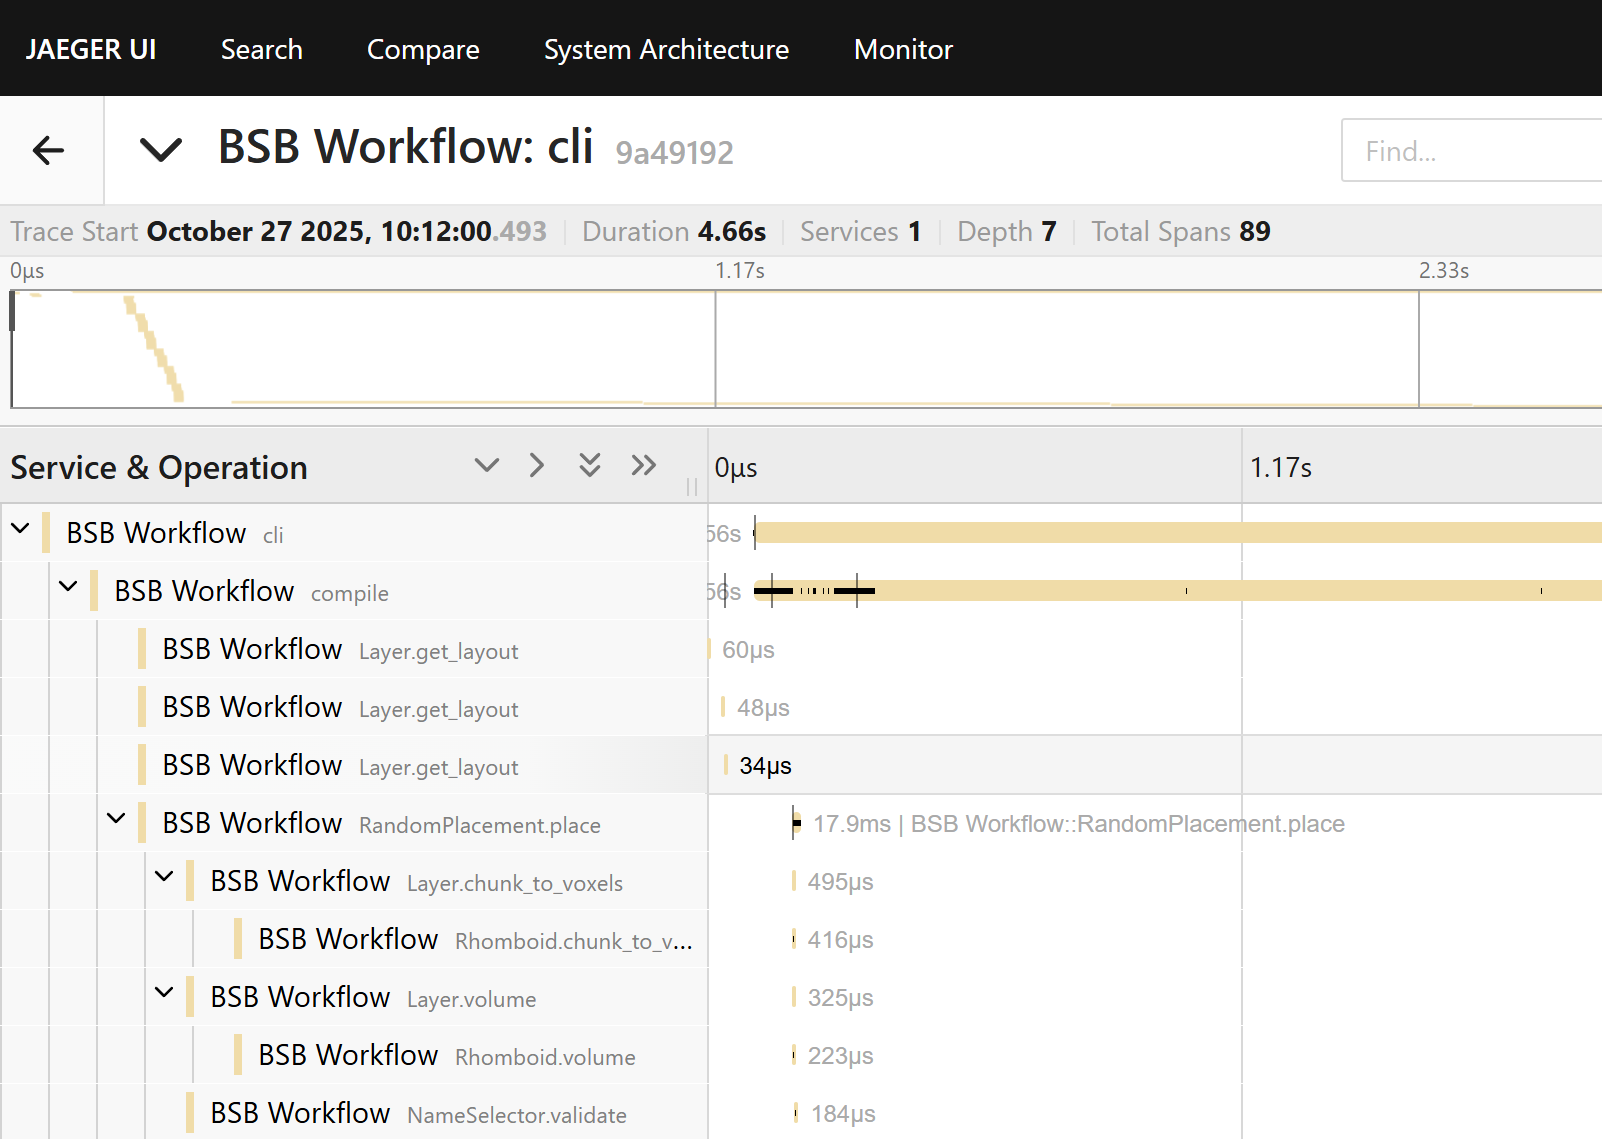
Once the bsb command has completed, on your Jaeger instance, you should see “BSB Workflow” appear under the Service dropdown. Click Find Traces. Select a trace from the timeline, and you should see a timeline graph of the process.
Important
While your BSB process is running, the “BSB Workflow” will start
appearing on your Jaeger interface; but remember that only the traces
from completed functions are sent to Jaeger. In the above example, you
will not see the cli and compile function until the reconstruction
has been completed.
Collecting telemetry data on HPC
Sometimes you are running processes on a remote machine (e.g., an HPC node) where you cannot run or view the Jaeger UI locally. In such cases, you can configure OpenTelemetry to send traces and metrics from the remote machine to a collector running on your own local machine. Using a tunneling service like ngrok allows the remote processes to connect to your local collector over the network.
Step-by-step guide
Install ngrok
Follow the official ngrok installation guide for your platform on your local machine (not the HPC). Start a working agent and obtain a public endpoint address (e.g., 0.tcp.ngrok.io:12345) for the port your local OpenTelemetry collector is listening on.
When starting ngrok, forward the OTLP gRPC port (4317) from your local machine:
ngrok tcp 4317
This will display the public endpoint that remote HPC processes should use as their OTLP endpoint.
Start your OpenTelemetry collector locally
Make sure your collector (e.g., Jaeger on port 4317) is running:
docker start jaeger
Run remote HPC processes with full OpenTelemetry CLI configuration
On the HPC nodes, specify the OTLP endpoint and disable TLS directly in the opentelemetry-instrument command:
opentelemetry-instrument \
    --traces_exporter otlp \
    --exporter_otlp_endpoint http://0.tcp.eu.ngrok.io:12345 \
    --service_name "BSB Workflow" \
    python -m bsb compile --clear
Verify traces
On your local machine, open the Jaeger UI:
http://localhost:16686
Traces will appear after the BSB workflow has concluded.
Notes
Ensure the firewall on your local machine allows outbound ngrok connections and that the remote HPC nodes can reach the ngrok TCP endpoint.
Ensure you are forwarding the TCP port, and using a http:// prefix in the OTLP endpoint URI.
Ngrok free accounts may have dynamic addresses; update the remote OTLP endpoint in the command if it changes.
Collecting telemetry data with MPI/SLURM
The workflow through MPI/SLURM is the same, simply prepend the command with mpirun/srun and it works the same:
mpirun -n 4 \
  opentelemetry-instrument \
    --traces_exporter otlp \
    --exporter_otlp_endpoint http://0.tcp.eu.ngrok.io:12345 \
    --service_name "BSB Workflow" \
    python -m bsb compile --clear
Important
Remember that only completed BSB functions will appear on the collector interface, which might make it difficult to read the traces while the BSB process is running, especially in multicore. Once the process is completed though, you should see the traces of each core cleanly separated.
Please note this only works for CLI commands (or python -m bsb). If you’re using the BSB via Python with MPI, you might notice that all the MPI ranks are reporting to different traces. To fix this, wrap all BSB code as such:
from bsb_otel.tracer import get_bsb_tracer

tracer = get_bsb_tracer("my-package")
with tracer.trace("My Script"):
    # Your BSB code here
Now you should see all of the BSB telemetry reported in a single trace again.
Exporting traces to JSON Lines
When no live collector is reachable, for example on an HPC compute node, the BSB can write traces to a local file as newline-delimited JSON (one span per line) instead of streaming them to Jaeger. The file is appended as spans complete, so a trace from a run that crashes or is killed is still readable up to the point of failure.
Note
A span is written only once it ends. Hard terminations that skip stack
unwinding, such as MPI_Abort (Abort()) or
_exit(), cannot be caught, so any spans still open at that moment
are never exported. Spans that have already completed stay in the file.
Two pieces from bsb-otel provide this:
the
jsonlinestraces exporter (JSONLinesSpanExporter), andthe
bsb_jsonlinesOpenTelemetry distro, which selects that exporter together with a configurator that builds aTracerProviderbacked by aSimpleSpanProcessor.
Select the exporter directly:
OTEL_EXPORTER_JSONLINES_PATH=./traces.jsonlines \
opentelemetry-instrument \
    --traces_exporter jsonlines \
    --service_name "BSB Workflow" \
    python -m bsb compile --clear
or activate the distro, which wires up the exporter and processor for you:
OTEL_PYTHON_DISTRO=bsb_jsonlines \
OTEL_EXPORTER_JSONLINES_PATH=./traces.jsonlines \
opentelemetry-instrument \
    --service_name "BSB Workflow" \
    python -m bsb compile --clear
OTEL_EXPORTER_JSONLINES_PATH sets the output file (default
traces_*.jsonlines). A * in the path is replaced with a random
8-character string, so concurrent processes each write a unique file. Under
MPI every rank writes its own file.
The distro’s configurator uses a SimpleSpanProcessor, which exports each
span synchronously as it ends, with no background export thread. This keeps it
safe under MPI, where the default BatchSpanProcessor’s daemon thread can
deadlock with mpi4py during interpreter shutdown.
Replaying traces into a collector
A JSON Lines file is not a live stream, so it does not appear in Jaeger on its
own. The replay-otel command re-emits its spans through the active
OpenTelemetry pipeline, preserving their original ids, parent links and status.
Run it under opentelemetry-instrument with the exporter aimed at your
collector:
opentelemetry-instrument \
    --traces_exporter otlp \
    --exporter_otlp_endpoint http://localhost:4317 \
    --service_name "BSB Replay" \
    bsb replay-otel traces_*.jsonlines
The replayed spans take on the --service_name of the replaying process, so
they group under that name in Jaeger. The file argument accepts several paths or
glob patterns: the per-rank files of an MPI run replay together, and because the
BSB broadcasts the root span context across ranks (see
the wrapping example above) they share one trace_id,
so Jaeger reassembles them into a single trace.
By default the command shifts the trace forward in time so it ends at the moment
of replay, keeping each span’s relative offset and duration. This lands the trace
inside a collector’s default search window (such as Jaeger’s lookback) without
any fiddling. Pass --keep-timestamps to replay at the original times instead,
then widen the lookback to find older traces.
Reading traces directly
For ad-hoc analysis, each line is one span serialised with OpenTelemetry’s
ReadableSpan.to_json, so a file loads with loads():
import json

with open("traces.jsonlines") as f:
    spans = [json.loads(line) for line in f if line.strip()]
Each span carries name, context (with trace_id and span_id),
parent_id, start_time, end_time, attributes and status;
group by trace_id to reconstruct a workflow.
Components
Everything above lives in the bsb-otel package. Its public helpers:
get_bsb_tracer()returns aBsbTracer; use itstrace()method as a context manager to add spans.local_tracing()anduse_communicator()scope which MPI communicator spans are broadcast on, for rank-divergent code paths.ensure_spans_on_exit()installs aSIGTERMhandler that unwinds active spans so telemetry survives a scheduler kill.JSONLinesSpanExporteris thejsonlinesexporter described above.replay_files()backs thebsb replay-otelcommand, re-emitting recorded spans into the active pipeline.OTelFixtureandwrap_tests_with_traces()record spans in tests.
See the bsb-otel documentation for the full reference.
Profiling
The BSB includes a profiling module that can be enabled through various methods:
Command line flag:
python -m bsb compile --profiling
Environment variable:
export BSB_PROFILING=1
python -m bsb compile
Configuration option in code:
from bsb import options
options.profiling = True
The profiling results will be collected and can be analyzed to identify performance bottlenecks and optimization opportunities.